The 3 Stages of Maintenance
Most machine shops are stuck in Stage 1 or 2. Stage 3 is where the profit margins live.
- 1. Reactive (Run-to-Failure): "Fix it when it smokes." Highest cost due to unplanned downtime and collateral damage.
- 2. Preventive (Interval-Based): "Replace it every year." Wastes money by replacing good parts too early.
- 3. Predictive (Condition-Based): "Act when condition trends justify action." Optimizes part life and reduces surprise failures.
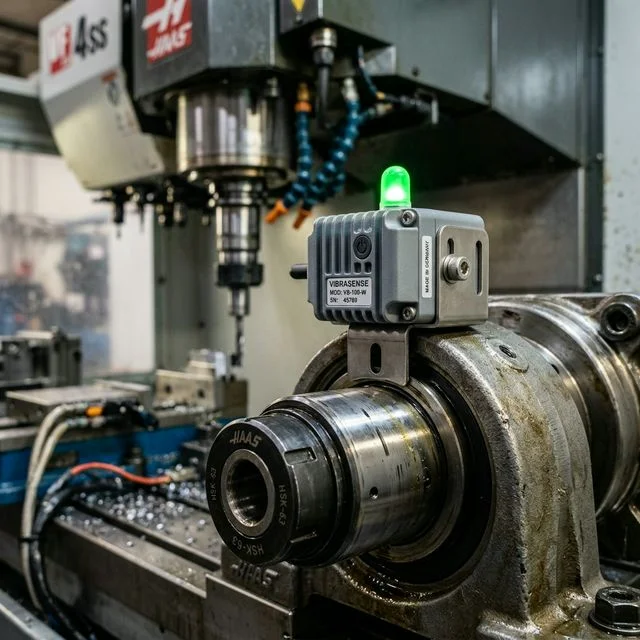
The P-F Curve Explained
The P-F Curve illustrates the interval between Potential Failure (P) and Functional Failure (F).
Failure Detection Timeline
By the time you can hear a spindle bearing screaming, you are already near the end of the curve. Predictive tools (vibration, oil analysis, thermography) can surface abnormal trends earlier (Point P), giving you time to validate the signal, order parts, and schedule the repair.
Vibration alarms should not be copied from a generic CNC threshold table. For vibration severity or acceptance criteria, verify the current published ISO 20816-3:2022 record, the applicable machine class or OEM limits, and your site baseline trends before setting alarm limits.
Calculating the ROI
A simple vibration monitoring system might cost $2,000 per machine. Is it worth it?
The $40,000 Saving Scenario
Without Monitoring:
Spindle siezes mid-cut on a Friday. Customer rush order is late.
Rush Repair: $15,000
Overtime: $2,000
Lost Production (3 days): $12,000
Late Penalties: $5,000
Total: $34,000
With Monitoring:
Sensor flags a rising vibration trend. Maintenance validates against baseline and OEM limits.
Scheduled Rebuild: $8,000 (Standard Exchange)
Downtime: Scheduled (0 impact)
Total: $8,000
ROI = 325% on first failure prevention.